August brought a noticeable slowdown in closings across Southwest Colorado, even as home prices held fairly steady overall.
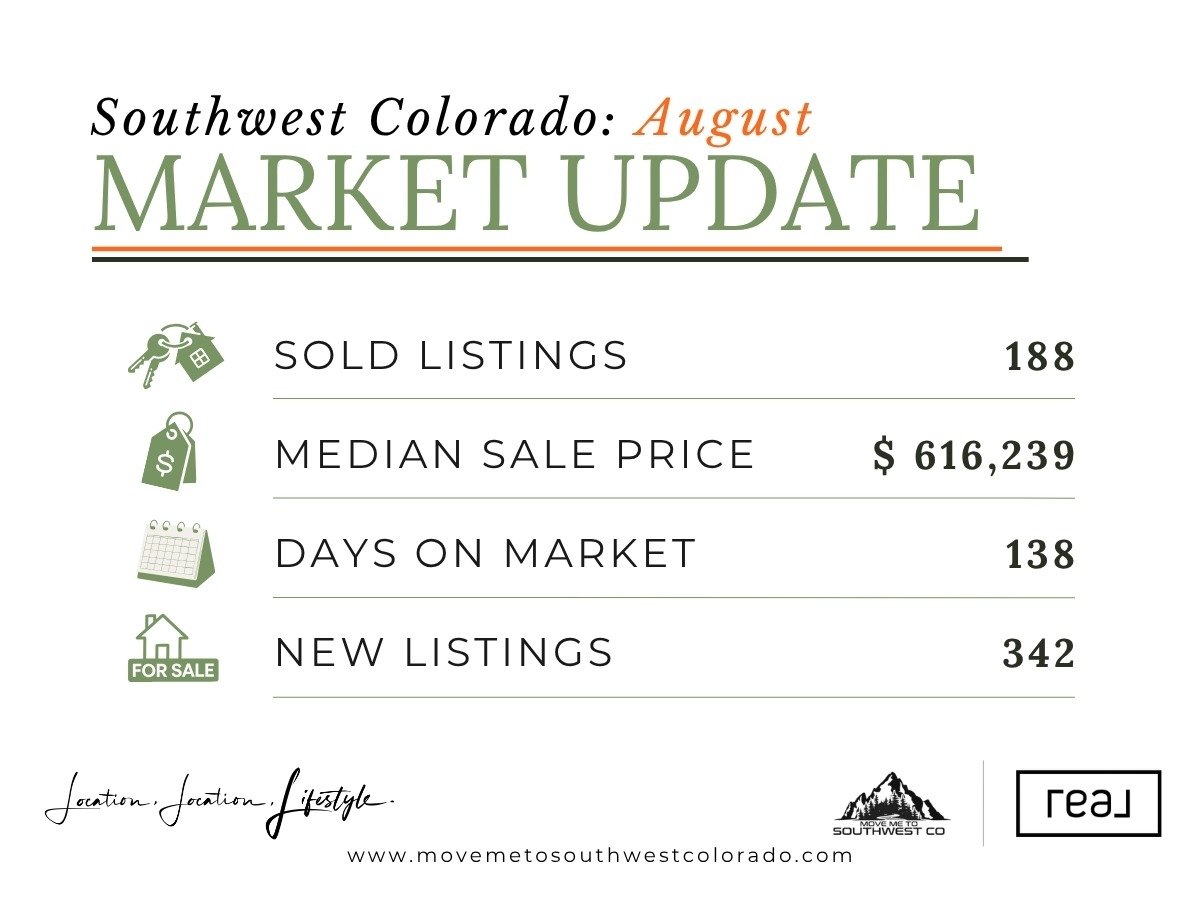
Across the seven counties we track, 188 properties sold in August, down 22.6% from 243 last August. The median sale price came in at $616,239, just 0.6% higher than a year ago.
Homes averaged 138 days on market, and 342 new listings came on during the month.
So there were fewer sales, but we didn’t see the same kind of drop in prices.
That’s what caught my attention this month.
How August Compares
Looking back gives the current numbers a little more perspective.
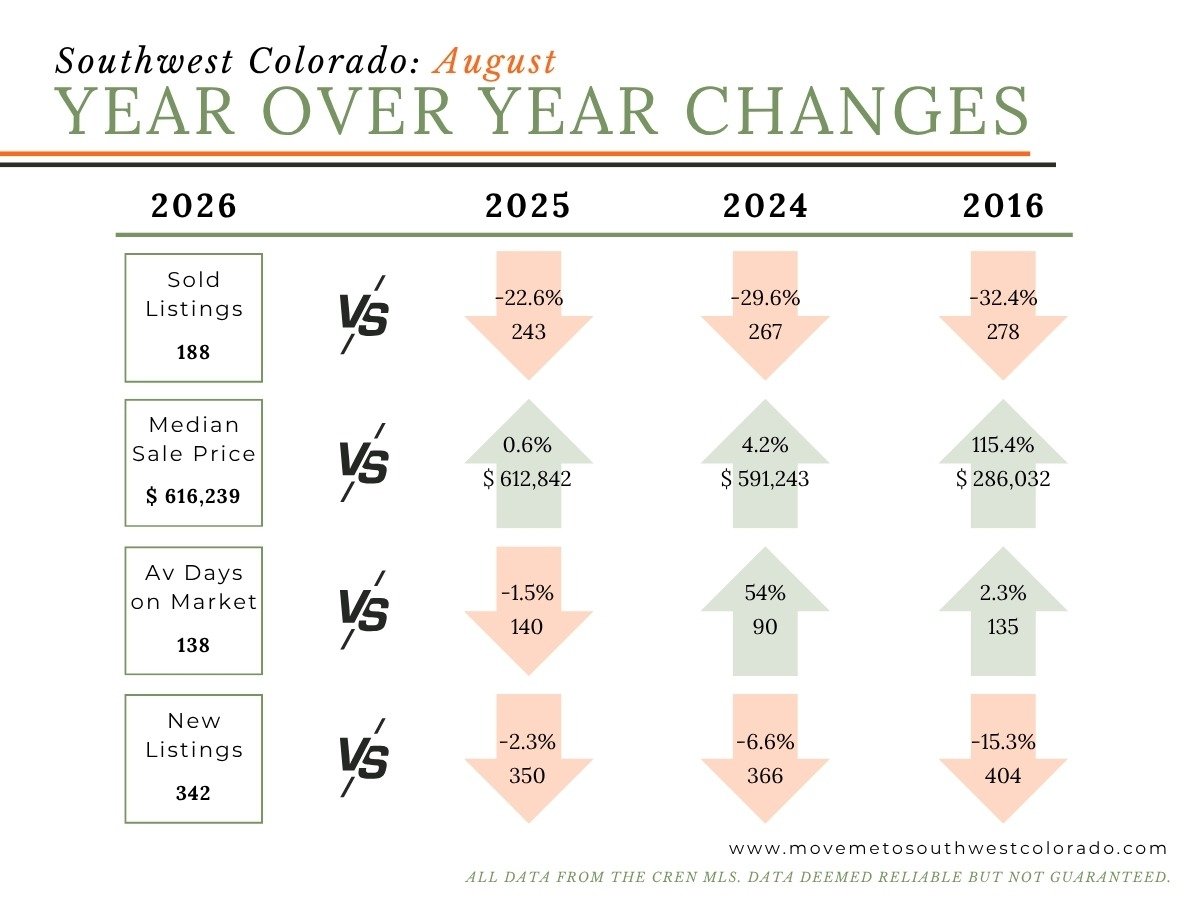
August sales were:
22.6% lower than 2025
29.6% lower than 2024
32.4% lower than August 2016
Meanwhile, the median sale price of $616,239 was:
0.6% higher than 2025
4.2% higher than 2024
115.4% higher than 2016
That’s an interesting combination.
We’re seeing considerably fewer transactions than we did a decade ago, while the typical sale price is more than double what it was then.
New listings are also lower than they were in those comparison years. August brought 342 new listings across the region, compared with 350 last year, 366 in 2024, and 404 in 2016.
A Look Around the Counties
The regional number is useful, but Southwest Colorado is made up of several very different markets.
Here’s what August looked like county by county.
La Plata County
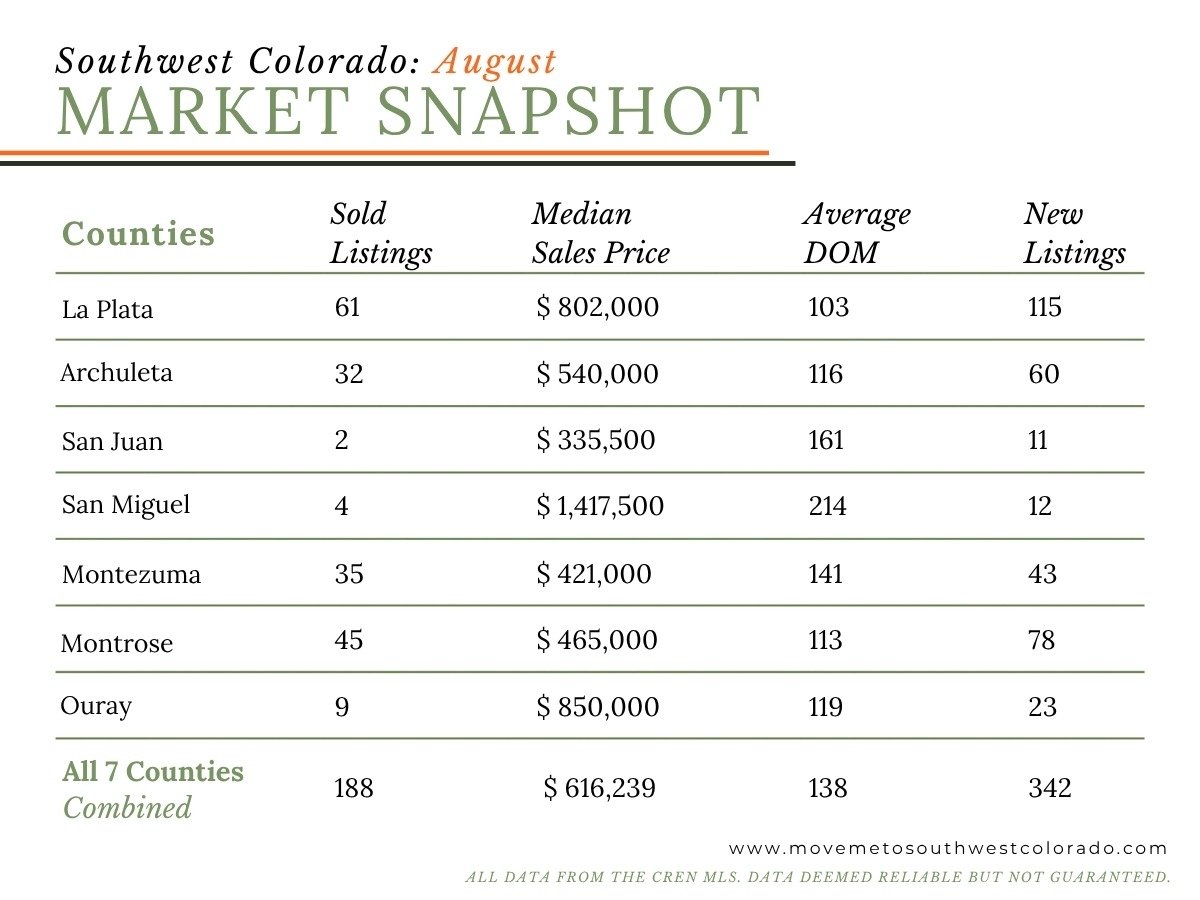
La Plata County recorded 61 sales in August with a median sale price of $802,000.
That median is up considerably from $659,500 last August, even though the number of sales fell from 100 to 61.
Homes averaged 103 days on market, and 115 new listings came on during the month.
With fewer transactions than a year ago, I’d be careful about treating one month’s price movement as a new trend. Still, the August numbers show that buyers continue to pay strong prices for the homes that are selling.
Archuleta County
Archuleta County had 32 sales, a median price of $540,000, and an average of 116 days on market.
The median was down from $592,000 last August, while the average sold price moved higher.
That difference is a good reminder that the homes closing in any given month can shift these numbers quite a bit.
Montezuma County
Montezuma was one of the more active counties this August.
35 properties sold, up from 25 last August. The median sale price was $421,000, compared with $410,000 a year ago.
That gives Montezuma a very different August story from much of the rest of the region, where sales generally slowed.
Montrose County
Montrose recorded 45 sales with a median sale price of $465,000.
That median was fairly close to last August’s $472,500, while sales dropped from 53 to 45.
Homes averaged 113 days on market, and 78 new listings were added.
Ouray County
Ouray had 9 sales in August, compared with 18 last year.
The median price was $850,000 — exactly the same as August 2025.
With only nine transactions, I wouldn’t make too much of one month’s price movement here. Smaller markets can change quickly depending on which homes close.
San Juan County
Only 2 properties sold in San Juan County during August.
The median sale price was $335,500, compared with $741,000 last August.
Both years had only two sales, so that price comparison says much more about the individual properties that sold than it does about the value of San Juan County real estate as a whole.
San Miguel County
San Miguel County reported 4 MLS sales in August with a median sale price of $1,417,500.
And there’s an important qualification with these numbers:
San Miguel County does not fully disclose all public sales data. The figures included here represent the subset of activity reported through the CREN MLS and should not be considered a complete count of all real estate transactions in the county.
That’s important to remember anytime we compare San Miguel with the other counties in this report.
Durango: Fewer Closings, Higher Median Price
Durango had a much quieter August than it did last year.
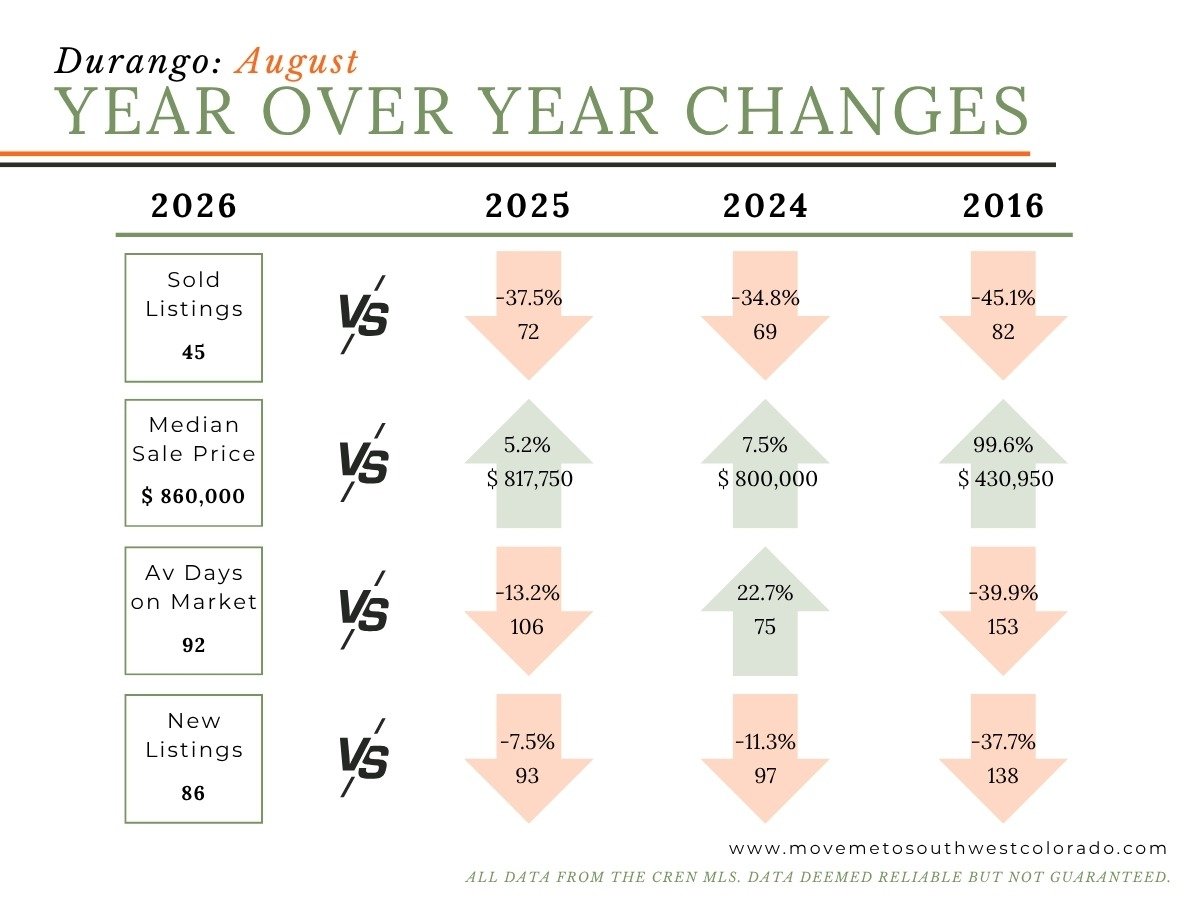
45 homes sold, compared with 72 in August 2025 — a 37.5% decrease.
At the same time, the median sale price increased 5.2% to $860,000.
Homes that sold also moved more quickly, averaging 92 days on market, compared with 106 days last August.
And 86 new listings came on the market, down from 93 a year ago.
One thing worth remembering: August was slow, but Durango is still ahead of last year when we look at total sales through the first eight months of the year.
So I wouldn’t use one slower month to describe the entire 2026 market.
Pagosa Springs: Prices Pulled Back
Pagosa Springs recorded 30 sales in August, down 21.1% from 38 last year.
The median sale price fell 9% to $538,500, compared with $592,000 last August.
Homes averaged 119 days on market, down from 130 days last year.
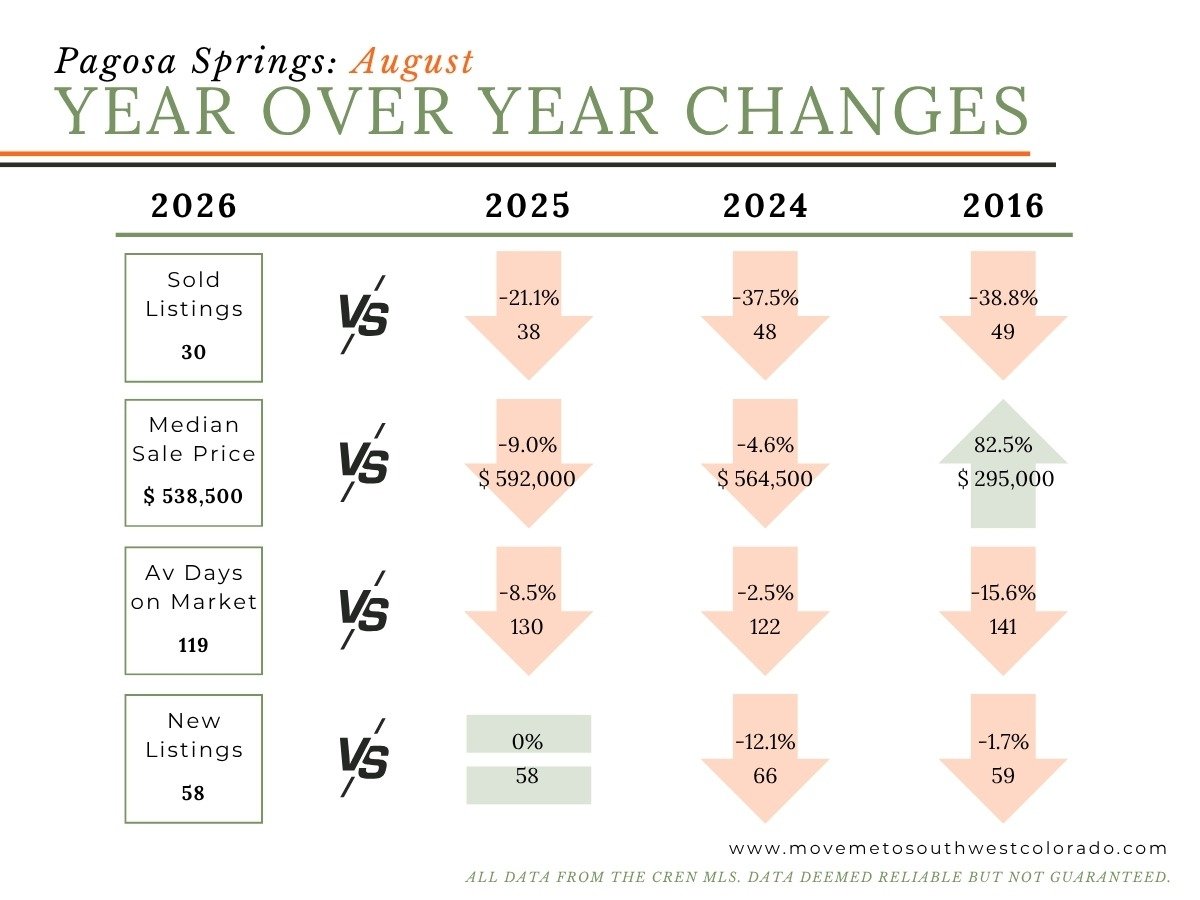
Of the three towns we’re highlighting this month, Pagosa had the clearest year-over-year decline in median pricing.
I’ll be watching to see whether that continues into fall or whether August turns out to be a softer month within a fairly variable market.
Bayfield: One Month, Twelve Sales, Big Price Movement
Bayfield’s numbers need some context.
There were only 12 sales in August, down from 23 a year ago.
The median sale price, however, climbed 23.3% to $629,000.
Average days on market rose from 79 to 121 days, and 27 new listings came on the market compared with 21 last August.
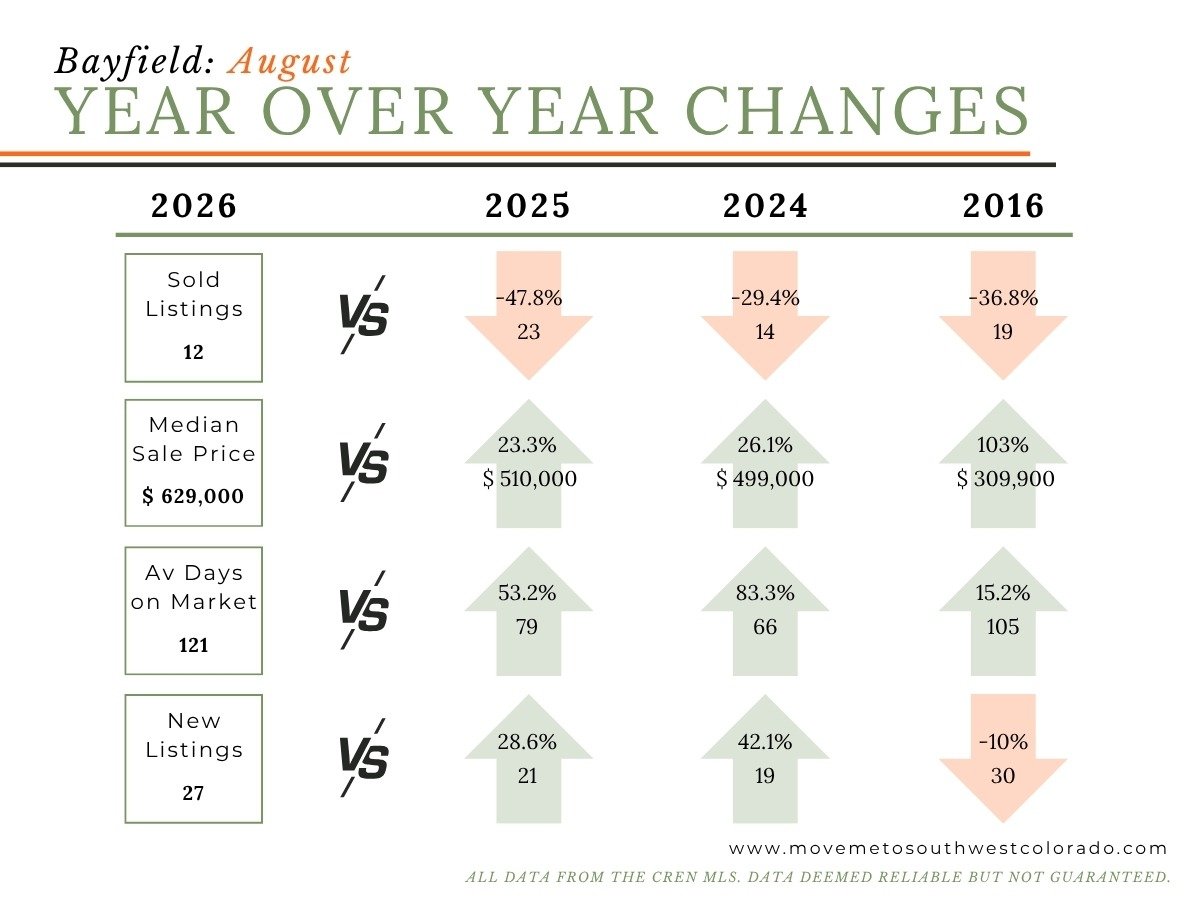
With only 12 sales, a relatively small number of higher-priced properties can move the median and average quickly.
So I wouldn’t interpret that 23% increase as Bayfield home values suddenly jumping by the same amount.
It tells us what sold in August. We need more than one month to tell us where pricing is actually heading.
What I’d Take From August If You’re Buying
There are fewer transactions happening than we saw last year, and buyers generally have more time to look carefully at their options.
That doesn’t mean every seller is eager to negotiate. Well-priced homes in good locations can still get plenty of attention.
But this is a market where buyers can afford to look closely at price, condition, location, and how long a property has been sitting before deciding what kind of offer makes sense.
And If You’re Selling?
August makes one thing pretty clear: buyers are being selective.
Your price needs to make sense when someone compares your home with everything else available.
And the regional averages only get you so far.
A Durango home at $850,000 is competing in a very different market from acreage outside Bayfield, a condo in Pagosa, or a property in Cortez.
That’s why I’d always rather look at the recent sales and current competition around your specific property before talking about price.
What I’m Watching Next
I’ll be watching two things as we head into fall:
How many homes continue to sell, and whether prices keep holding while sales volume remains lower.
August showed that fewer closings don’t automatically translate into lower prices. But the story is different depending on where you look, and that’s exactly why we track these markets separately.
September should tell us a little more.
If you’re wondering what the August numbers mean for your home, your neighborhood, or the area where you’re thinking about buying, reach out. I’m always happy to dig into the local numbers with you.
All market data from the CREN MLS. Data deemed reliable but not guaranteed. San Miguel County figures reflect only activity reported through the MLS and do not represent all public real estate sales in the county.