
The January data presents a fascinating contradiction.
Typically, when homes sit on the market for longer, prices soften. But this January, we saw the exact opposite. While the pace of the market has slowed significantly, home values haven't just held firm—they have jumped.
The data reveals a "standoff" market: Sellers are willing to wait months to get their number, and buyers are taking their time to choose. The result is a market that is slower, but wealthier.
The Headline Numbers
-
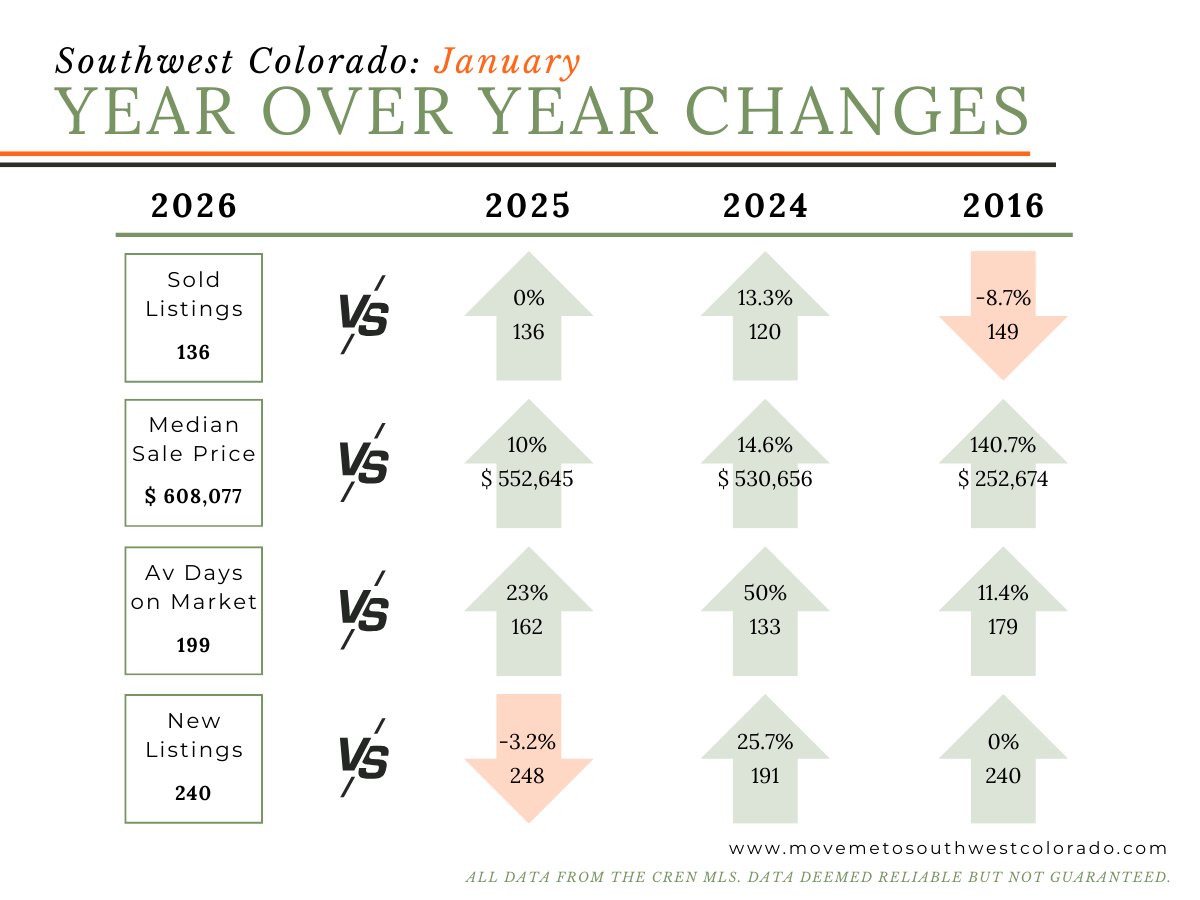
Median Sales Price: $608,077 (+10% Year-Over-Year)
-
Days on Market: 199 Days (+23% Year-Over-Year)
-
Sold Listings: 136 (0% Change / Flat)
You might notice this price figure looks different from our 2025 Year-End Recap. In our annual report, we used "Average Price," which can be skewed by a few ultra-luxury ranch sales. For our monthly updates, we are switching to "Median Price" (the exact middle of the market). This gives you a much more realistic picture of what a typical home sells for, without the multi-million dollar outliers distorting the data.
When we look at the region as a whole (All 7 Counties), the data suggests a market that is holding its ground.
-
Values are Up 10%: The regional median price climbed from $552,645 last year to $608,077 this month. Despite interest rates and national headlines, local equity is continuing to grow.
-
New Supply is Stable: We saw 240 new listings hit the market in January, which is nearly identical to the 248 new listings we saw last January (-3.2%). This tells us that sellers are not panicking; the flow of new homes coming to market is consistent and healthy.
-
The Wait is Longer: Days on Market (DOM) surged 23% to nearly 200 days (199 days average). Sellers are getting their price, but they are having to wait over six months on average to close the deal.
Market Snapshot: A Look Across the Region
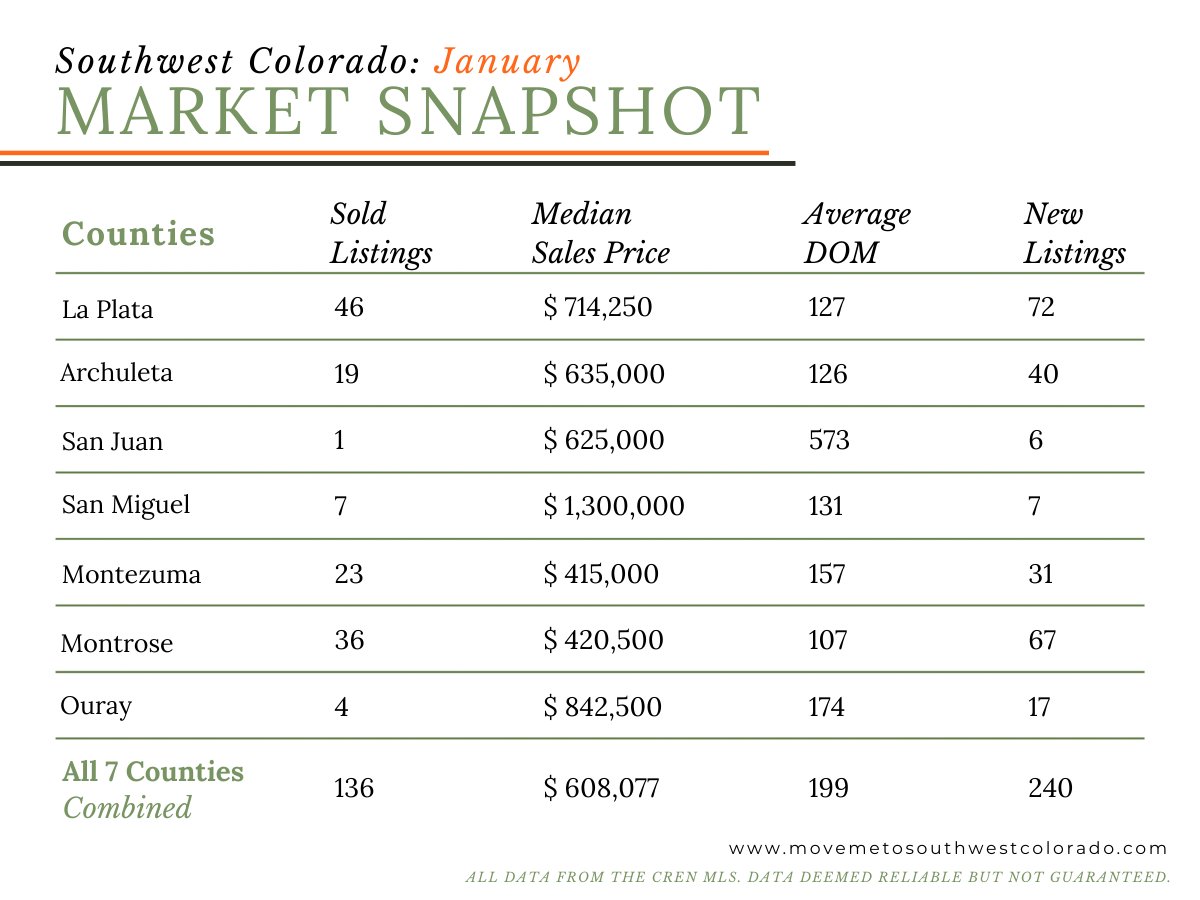
The regional activity was driven largely by La Plata County, which led the pack with 46 sold listings and a median price of $705,250. Montrose County followed closely with 36 sales, maintaining its reputation for efficiency with 107 Days on Market and an accessible median price of $420,000.
On the affordability front, Montezuma County continues to offer the best entry point, averaging a median of $415,000 across 23 sales, with homes lingering on the market for roughly 167 days. Meanwhile, Archuleta County (Pagosa Springs) had a solid showing with 19 sales and a median price of $635,000. The luxury sector in San Miguel recorded 7 sales with a median price of $1,587,000.
Note on San Miguel County (Telluride): San Miguel County does not fully disclose public sales data. The figures referenced here (7 sales / $1.58M median) represent only the subset of sales reported through the MLS and may not reflect the total activity in that luxury market.
City Spotlights: How January Shifted the 2025 Trends
In our 2025 Recap, we saw a region divided. Now, the first month of 2026 shows those trends evolving in surprising ways.
Durango: The Resilient Rock
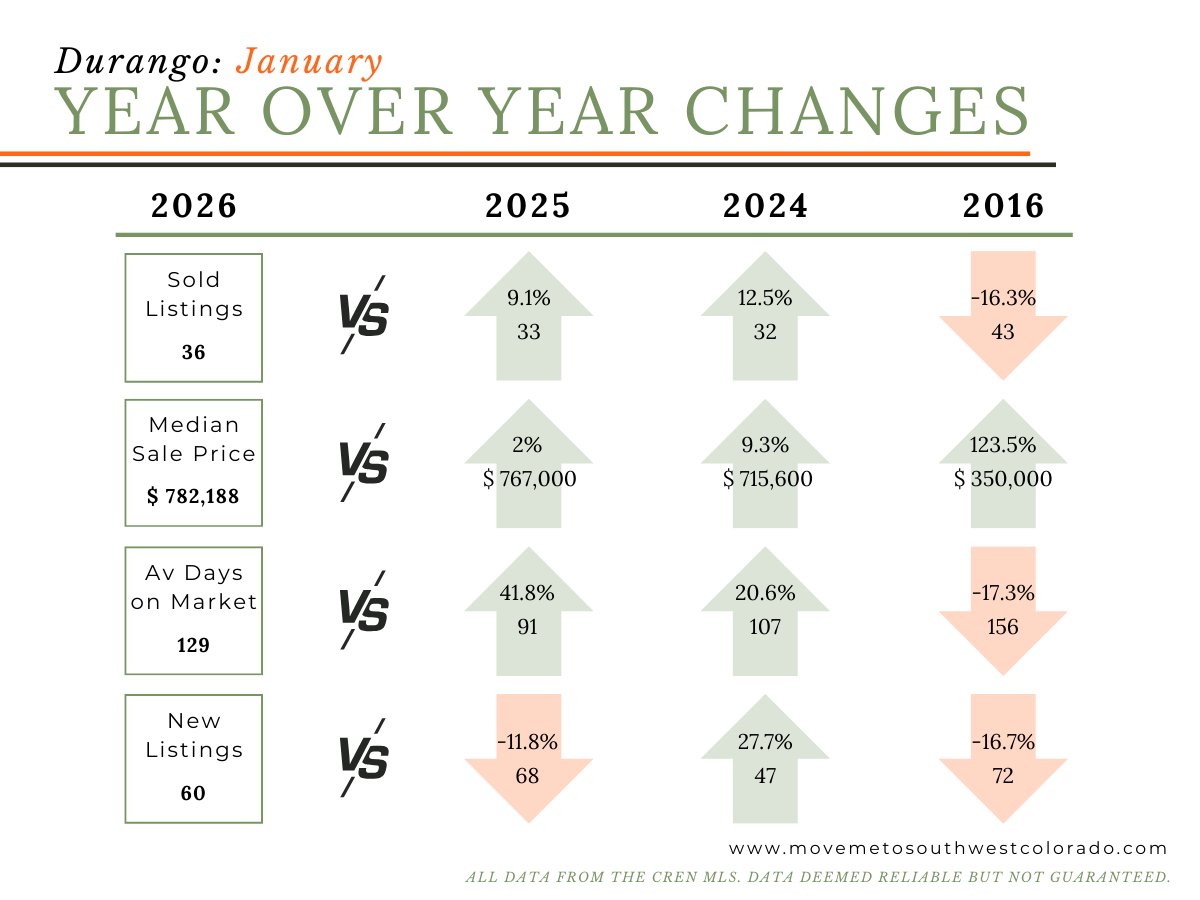
Last year (2025 Recap), Durango was defined by rising prices but falling sales—a "selective" market. January’s data shows a key shift. Prices held firm (Median $782,188, up 2% year-over-year on a month-to-month basis), but unlike on our 2025 Recap, buyers are back in force. Sold listings jumped 9.1%. However, patience is required; the average Days on Market shot up nearly 42% to 129 days. Sellers are getting their price, but they are waiting longer for it.
Pagosa Springs: The Growth Engine
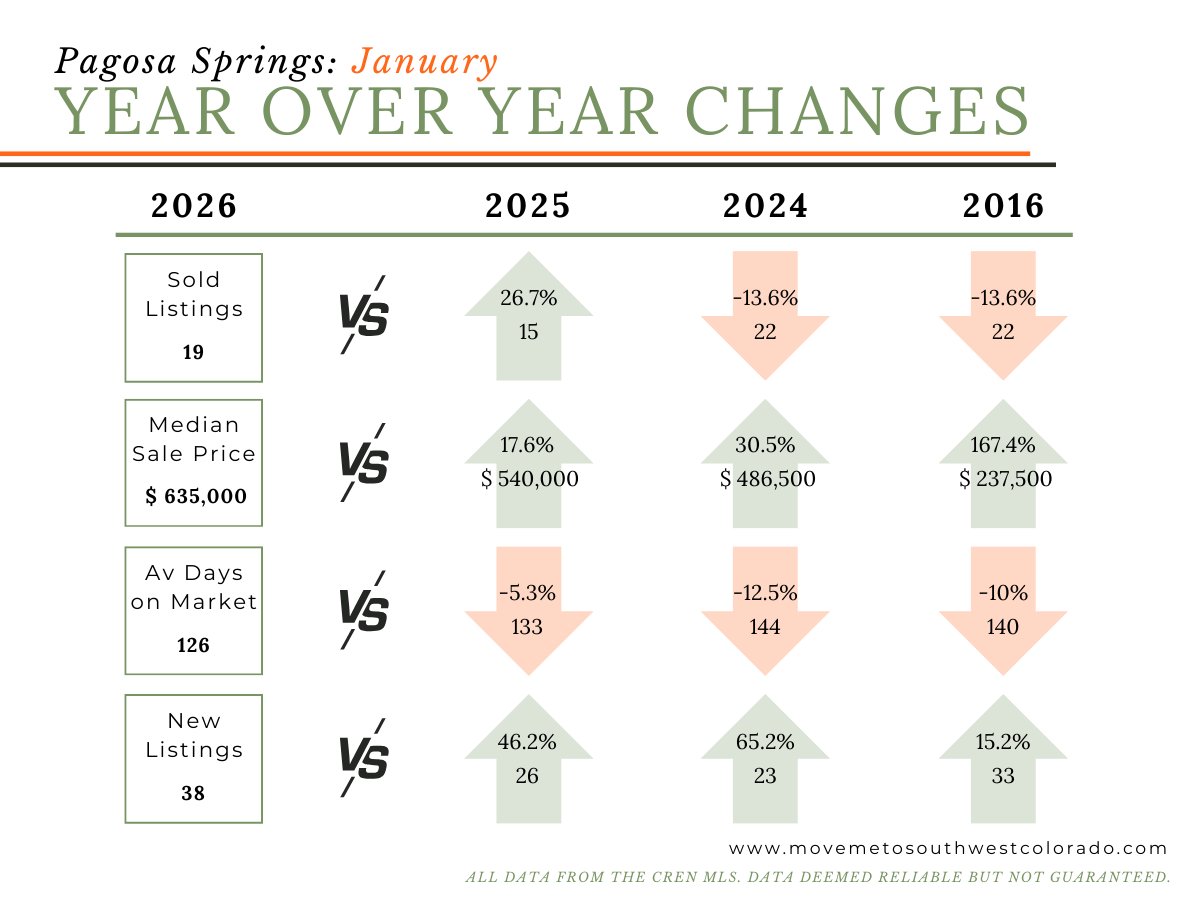
Pagosa Springs is currently the hottest market in the area. Sold Listings jumped 26.7%, and prices surged 17.6% to a median of $635,000. Even more telling is the inventory surge: New Listings are up 46.2%. This is a vibrant, active market where supply and demand are both growing. The "discount" window in Pagosa appears to be closing as competition heats up.
Bayfield: The "Value Play" Hits a Wall
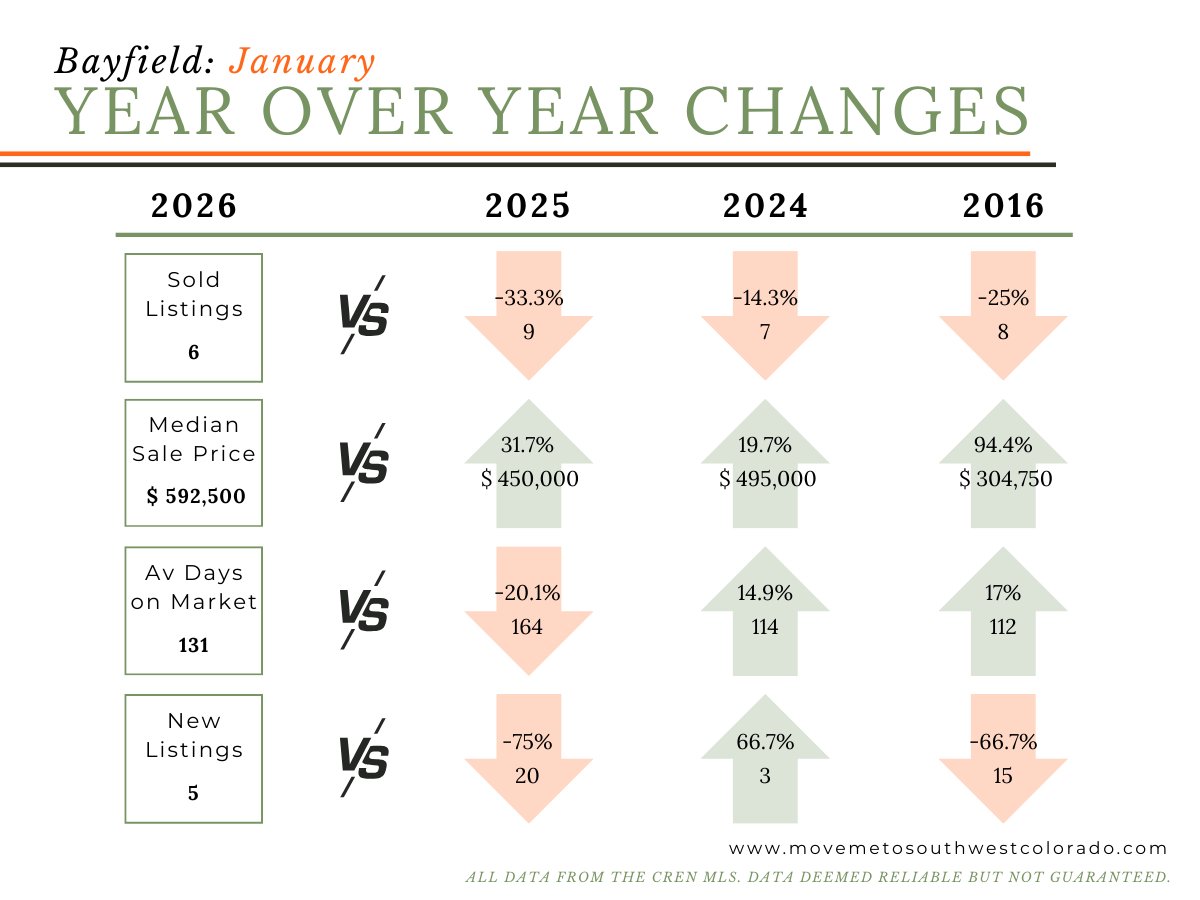
In 2025, Bayfield was the smart value play, driving sales growth. But January brought that to a halt for one reason: Bayfield is suffering from an inventory drought. New Listings plummeted 75% year-over-year, with only 5 new homes hitting the market. This scarcity drove the median price up a massive 31.7% to $592,500, even though actual sales volume dropped by 33% due to the lack of options.
While this might be the data for the city or region as a whole, there is still a huge possibility that the data is different in your immediate area. If you are curious where your area stands, send me a message and I'll gladly run the numbers for you.
What This Means for You
For Buyers: The data is shouting "Opportunity"—but strictly in terms of time, not price. With regional Days on Market hitting 199, the pressure to "rush" is gone. You now have the luxury of viewing a home multiple times, running the numbers, and negotiating terms without a bidding war breathing down your neck. However, do not mistake a slower market for a "crash." With median prices up 10%, sellers are holding firm on value. The opportunity here is the ability to make a thoughtful, well-researched decision, not necessarily to get a bargain-basement steal.
For Sellers: The key word for 2026 is Patience. The days of the 24-hour sale are largely behind us. With the average home taking over 6 months to sell, you must be prepared for the long haul. Buyers are active (sales volume is flat/stable), but they are value-conscious and deliberate. To succeed in this market, your pricing strategy needs to be sharp from day one—aspirational pricing will only leave you stuck on the market while other homes sell around you.
The Bottom Line
January was a reality check. The "growth at all costs" mindset is gone, replaced by a market that rewards value and patience. Prices have settled into a sustainable upward rhythm, and while the pace is slower, the stability in sales volume proves that it’s exactly what buyers were waiting for.
Curious about your specific neighborhood?
While this might be the data for the city or region as a whole, there is still a huge possibility that the data is different in your immediate area. Real estate is hyper-local, and neighborhood trends often defy regional averages.
If you are curious where your area stands, send me a message by clicking the envelope icon below and I'll gladly run the numbers for you.


